DDQ THU 2020-08-25 @ 12:45 PM
3. Time to Learn
3.1. Agenda
General Announcements
F2F availability begins MON 08-31.
Term Project: Milestone 0: IRB Training
Activity
3.2. Activity
3.2.1. Introduction
Duration: \(\sim\) 5-10 minutes
Shneiderman et al. claim that a successful designer must go beyond the use of vague, subjective measures of, “user friendliness,” “intuitive,” and “natural,” and study evidence-based guidelines in the research literature. This does not mean that subjectivity goes away. On the contrary, it means that subjectivity might be accepted or rejected based on evidence. One of the usability measures that the book argues will lead more directly to practical evaluation is time to learn.
How long does it take for typical members of the user community to learn how to use the actions relevant to a set of tasks?
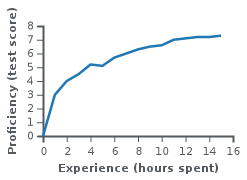
Fig. 3.1 An example of a subject becoming more proficient at a task as they spend more time doing it.
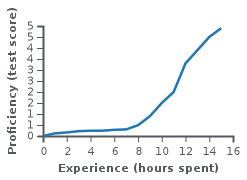
Fig. 3.2 An example of a subject who spends a lot of time but does not see an increase in proficiency at first.
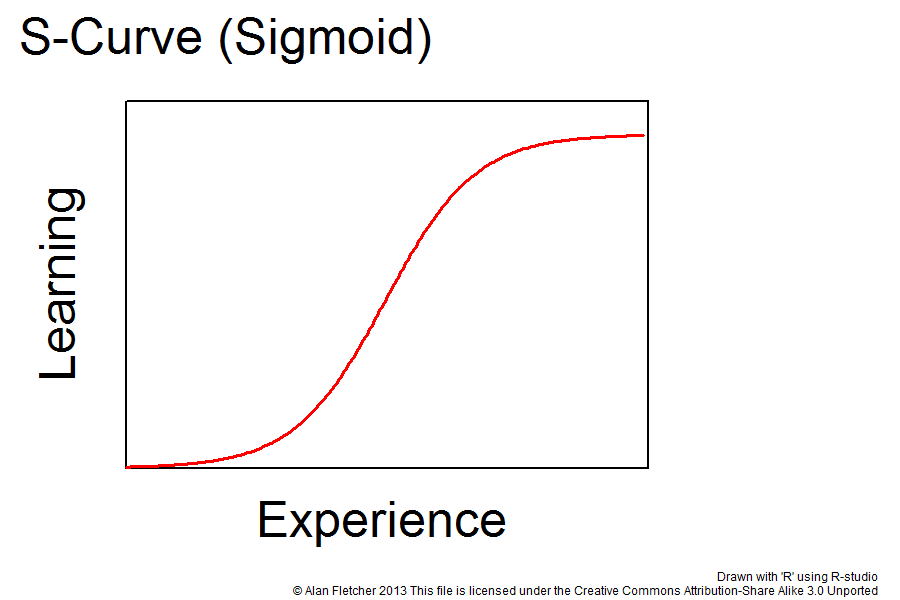
Fig. 3.3 An example of a subject exhibiting the idealized normal progression of discovery, learning, and reaching their limit.
- competence
The ability to do something successfully or efficiently.
- proficiency
Some measure of competence or skill.
- success rate
The percentage of tasks that users complete correctly.
- soft skills
Any skill related to one’s personality.
- hard skills
Any skills relating to a specific task or situation that involves methods, processes, procedures, or techniques.
3.2.2. Breakout Rooms
Duration: \(\sim\) 10-15 minutes
Quick introductions, if needed.
Brainstorm to determine a computer-related interface design that one or more of your group members learned how to use.
Pick one, non-trivial task related to that interface.
Respond to the following in a followup discussion here.
Include a visual example of the interface (e.g., a screenhot, photo, drawing).
Provide two descriptions of the task: one short and one with more detail.
How can you measure successful task completion?
How can you test successful task completion?
Do you think your test would still work if repeated (e.g., in a longitudinal study)? Why or why not?
Pick a group representative. This person will briefly share your group’s conceptual model to the class. No pressure, seriously!
Respond to other followup discussions until the breakout rooms end.
3.2.3. Back in Class
Duration: \(\sim\) 20 minutes
When asked, all group representatives should type
repinto chat.The instructor may ask group representatives to present by name or simply ask that they present in the order they’re listed in chat.